Results
The main goal of the 'OPERA' project was to develop a methodology and guidelines to support local authority planning for regional policies supporting national and European actions for compliance with air quality standards. The actions are also designed to take into account possible synergies with measures to reduce GHG emissions.
Thanks to the experience in two specific regions, Alsace and Emilia-Romagna, RIAT+ has been designed and tested to answer regional requirements in air quality planning.
Alsace: Optimisation with RIAT+
Example results for the optimisation of the mean NO2 concentration (in the sensitive zones, for the whole
year) and its side-effects on NO2 in winter, PM10, PM2.5 and ozone (SOMO35) are shown in Figures below.
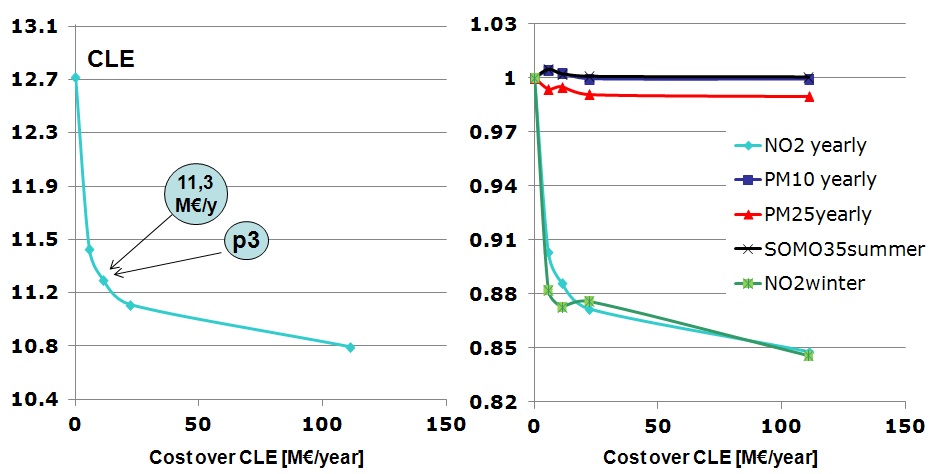
Results for the optimisation of NO2 (Pareto curve for NO2 yearly average concentrations, left) and contemporary Pareto for PM10 and ozone (right).
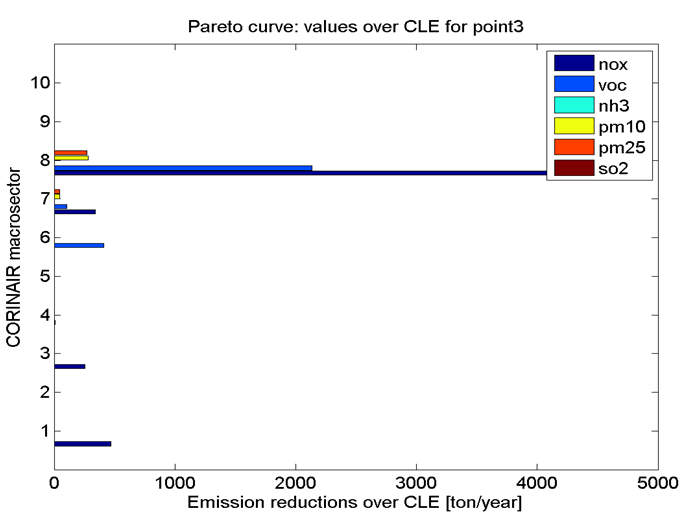
The Pareto curve (a curve providing the optimal solutions ranked by costs) shows five possible combinations of reduction measures and their cost and AQI. For the third point (p3) of the Pareto curve, following figure shows that emission reductions of NOX essentially occur in the sector “8: other mobile sources”, “7: road transport” and sectors “1: combustion in energy and transformation industries”. Costs (~11 M€/year above those requested by the Current Legislation) are mainly assigned to sectors 1 and 8.
RIAT+ produces a list of the measures and of their penetration to obtain these reductions.
RIAT+ emission reductions corresponding to point 3 of the Pareto curve (about 11 µg/m3 for NO2 average yearly concentration).
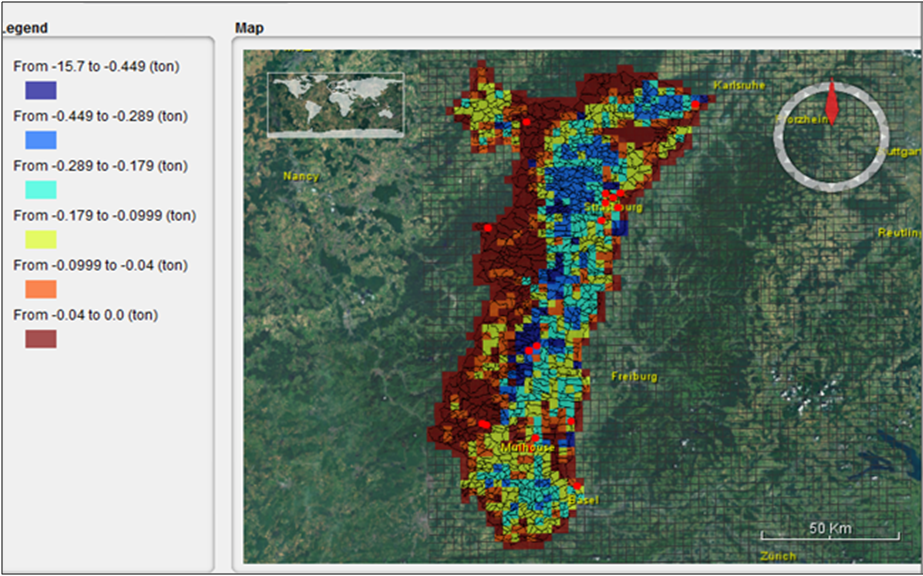
Absolute reduction of PM10 emission, obtained with RIAT+.
Emilia-Romagna: Optimisation with RIAT+
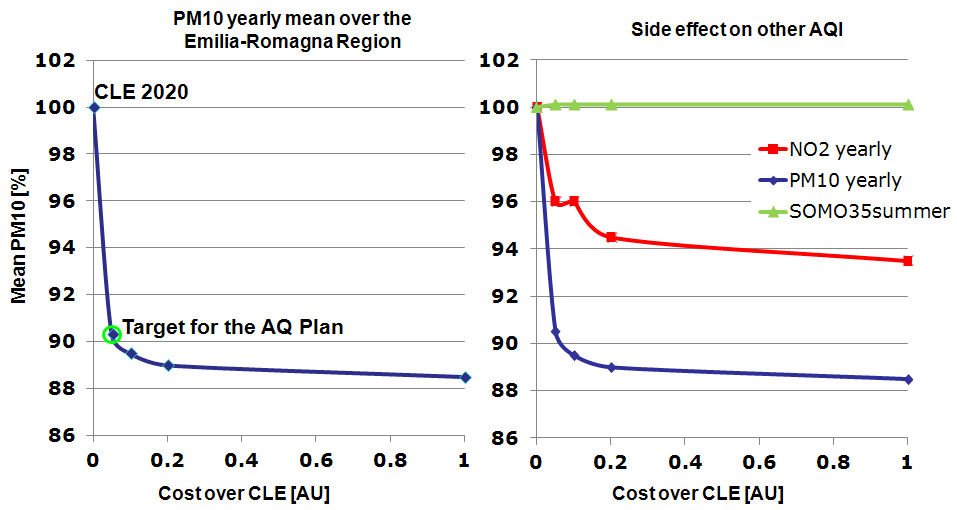
The emission scenarios and the resulting air pollution simulations have been produced on a domain grid covering the Emilia-Romagna region and the surrounding areas which influence the regional air pollution. The gridded emissions (year 2010) were prepared using the tool eFESTo. Air pollution concentrations have then been simulated for the year 2010 using NINFA (www.arpa.emr.it) computing air quality indicators (AQI) and producing source/receptor models. Different subdomains for the optimization have been defined: the whole Emilia-Romagna, nine Provinces, four “European reporting zones”, and the so-called “sensitive zone”. First, RIAT+ has been applied to the optimization of the yearly PM10 average on the whole Emilia-Romagna; the resulting Pareto curve is represented in the figures below showing five points each representing different optimal combinations of reduction measures. Pareto curve’s y-axis represents the pollution level as a spatial averaged over the whole domain in percentage reduction respect to the CLE 2020 value (1st point in the Pareto curve). The costs (x-axis) are indicated in percentage as values beyond CLE 2020 scenario.
Pareto curve for the optimisation of PM10 (yearly average concentrations in blue, and the corresponding effect on NO2 in red and ozone - AOT40 in green).
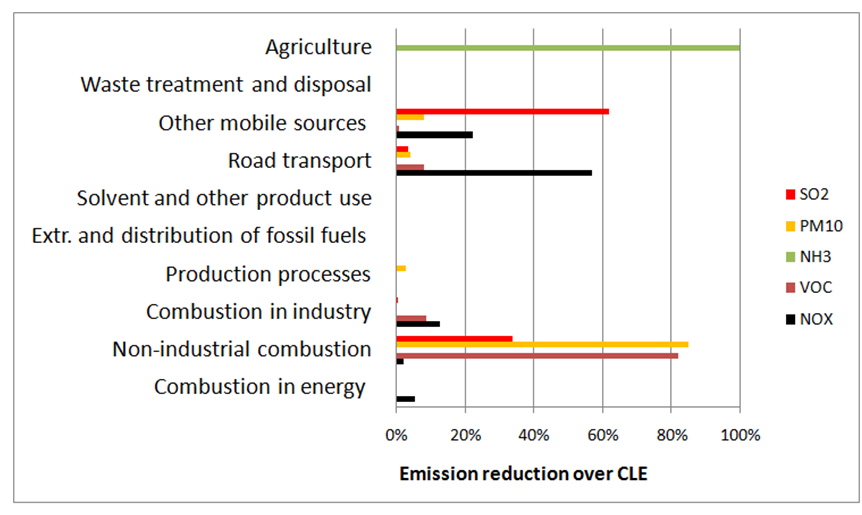
Analysing emission reduction (following figure) corresponding to point 3 of the Pareto curve, it can be seen that a significant reduction of NH3 should be reached acting on agriculture macrosector, while NOX reduction should be obtained through transport and other mobile sources macrosectors. Actions on residential heating should be promoted to reduce a large part of primary PM10 emission.
RIAT+ emission reductions corresponding to point 3 of the Pareto curve.
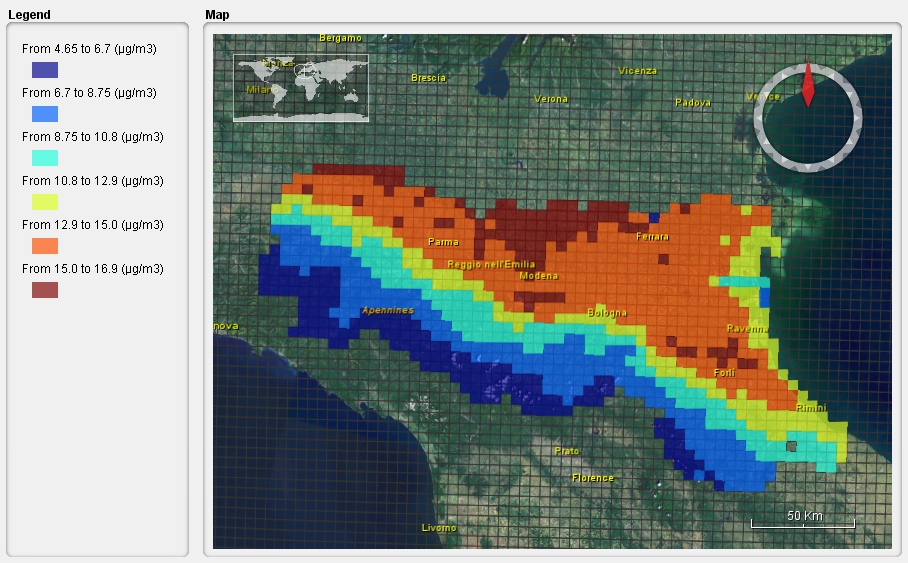
Average PM10 concentrations resulting in RIAT+ (point 3 of the Pareto curve).

